Example Notebook#
(Last updated: June 10, 2026)
You can also create content with Jupyter Notebooks. This means that you can include code blocks and their outputs in your book. In this notebook, we show some examples of loading and plotting data. Check this documentation about how to write executable content.
# Import packages
import pandas as pd
import plotly.express as px
import seaborn as sns

# Force Plotly to use different renderers depending on the situation
import plotly.io as pio
pio.renderers.default = "plotly_mimetype+notebook"
Load data#
You can put your data at the same directory as the notebook file and then use pandas to load the data.
# Load the Iris flower dataset using pandas
df = pd.read_csv("iris_data.csv")
df
| sepal_length | sepal_width | petal_length | petal_width | species | species_id | |
|---|---|---|---|---|---|---|
| 0 | 5.1 | 3.5 | 1.4 | 0.2 | setosa | 1 |
| 1 | 4.9 | 3.0 | 1.4 | 0.2 | setosa | 1 |
| 2 | 4.7 | 3.2 | 1.3 | 0.2 | setosa | 1 |
| 3 | 4.6 | 3.1 | 1.5 | 0.2 | setosa | 1 |
| 4 | 5.0 | 3.6 | 1.4 | 0.2 | setosa | 1 |
| ... | ... | ... | ... | ... | ... | ... |
| 145 | 6.7 | 3.0 | 5.2 | 2.3 | virginica | 3 |
| 146 | 6.3 | 2.5 | 5.0 | 1.9 | virginica | 3 |
| 147 | 6.5 | 3.0 | 5.2 | 2.0 | virginica | 3 |
| 148 | 6.2 | 3.4 | 5.4 | 2.3 | virginica | 3 |
| 149 | 5.9 | 3.0 | 5.1 | 1.8 | virginica | 3 |
150 rows × 6 columns
Plot data#
We set the repository in a way that you can use Plotly for interactive visualizations. For more information, check this documentation.
# Plot the Iris dataset using Plotly
g1 = px.scatter_3d(df,
                   x="sepal_width",
                   y="sepal_length",
                   z="petal_width",
                   color="species",
                   size="petal_length",
                   opacity=0.6,
                   size_max=30,
                   height=700)
g1
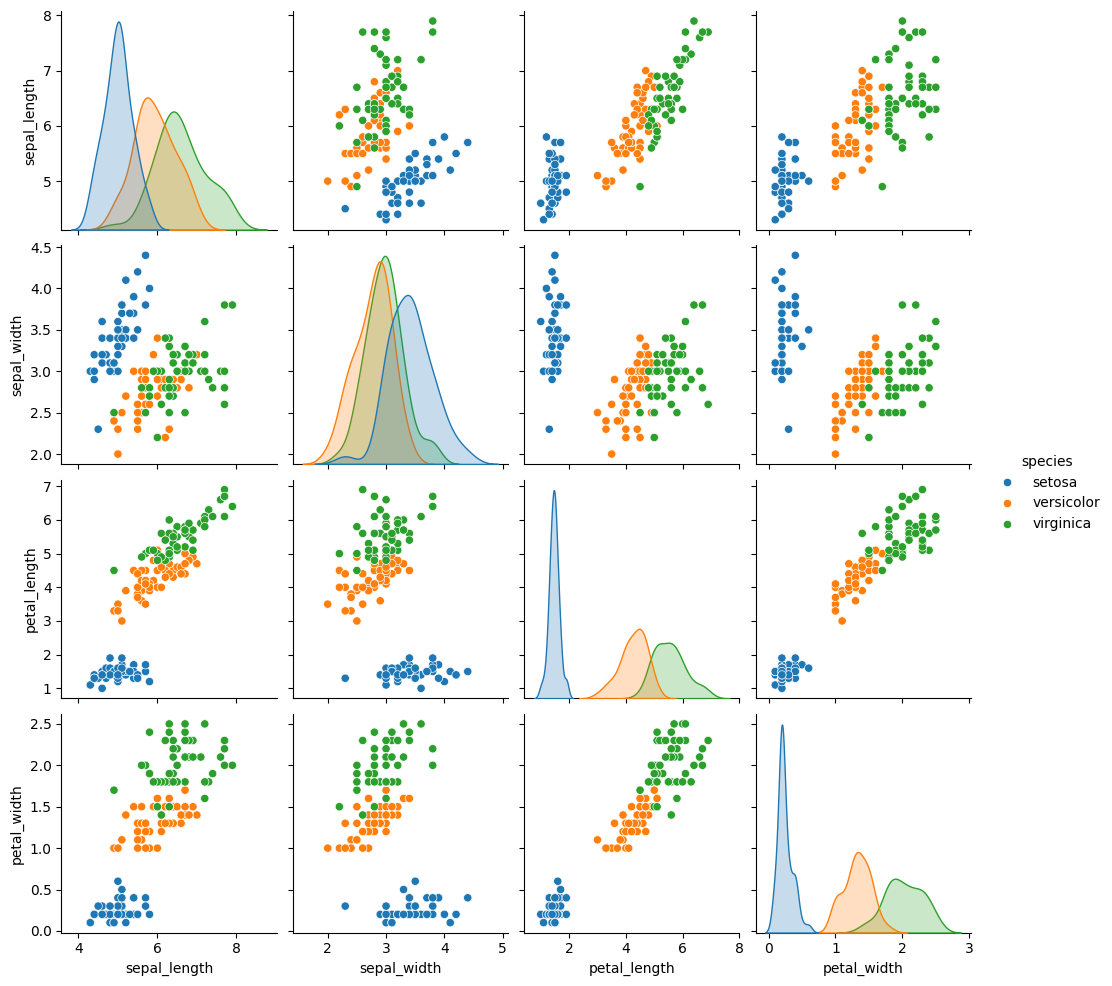
You can also plot the data using static visualizations, such as the seaborn library.
# Plot the Iris dataset using seaborn
g2 = sns.pairplot(df.drop("species_id", axis=1),
                  hue='species')
g2
<seaborn.axisgrid.PairGrid at 0x10f9a1e80>